 Dash Dev Tools
Dash Dev Tools is a set of tools to make debugging and developing Dash apps more productive & pleasant.
These tools are enabled when developing your Dash app and are not intended
when deploying your application to production.
Dash Dev Tools includes:
- Callback Graph - Dash displays a visual representation of your callbacks:
which order they are fired in, how long they take, and what data is passed back and forth between
the Dash app in the web browser and your Python code.
-
Code Reloading - Dash restarts your app when you change code in your project.
-
Hot Reloading - Dash automatically refreshes the web browser and
your CSS files when you make a code change so that you don’t need to manually
refresh your browser. -
In-App Error Reporting - Dash reports error messages in the browser
instead of your terminal so that you can stay focussed on your app and your code. -
Component Validation - Dash will display error messages if you pass
malformed data to your components. -
Better Error Messages - Dash prunes certain stack traces from Flask & Dash internals
and logs from Flask, Dash’s underlying web server. -
Serving Dev Bundles & Source Maps - For component authors, you can serve a different JavaScript bundle during development.
These Dev Tools features are turned on when the app is run in development
with run and when debug=True:
app.run(debug=True)
See the “Configuring Dash Dev Tools” section at the bottom to turn individual
features on and off.
This initiative was sponsored by a Dash Enterprise customer.
Interested in furthering our work here?
Ask your organization to sponsor Dash development
or license Dash Enterprise.
Callback Graph
This feature was originally sponsored by a customer in Dash v0.42.0 and
was recently improved in Dash v1.16.0 by Community Member @jjaraalm
in #1179. Many thanks @jjaraalm!
Screenshot
60 second demo video (no sound)
<iframe><iframe>
The Dash Dev Tools Callback Graph provides Live Introspection,
Profiling, and Live Debugging of your callback graph.
This includes:
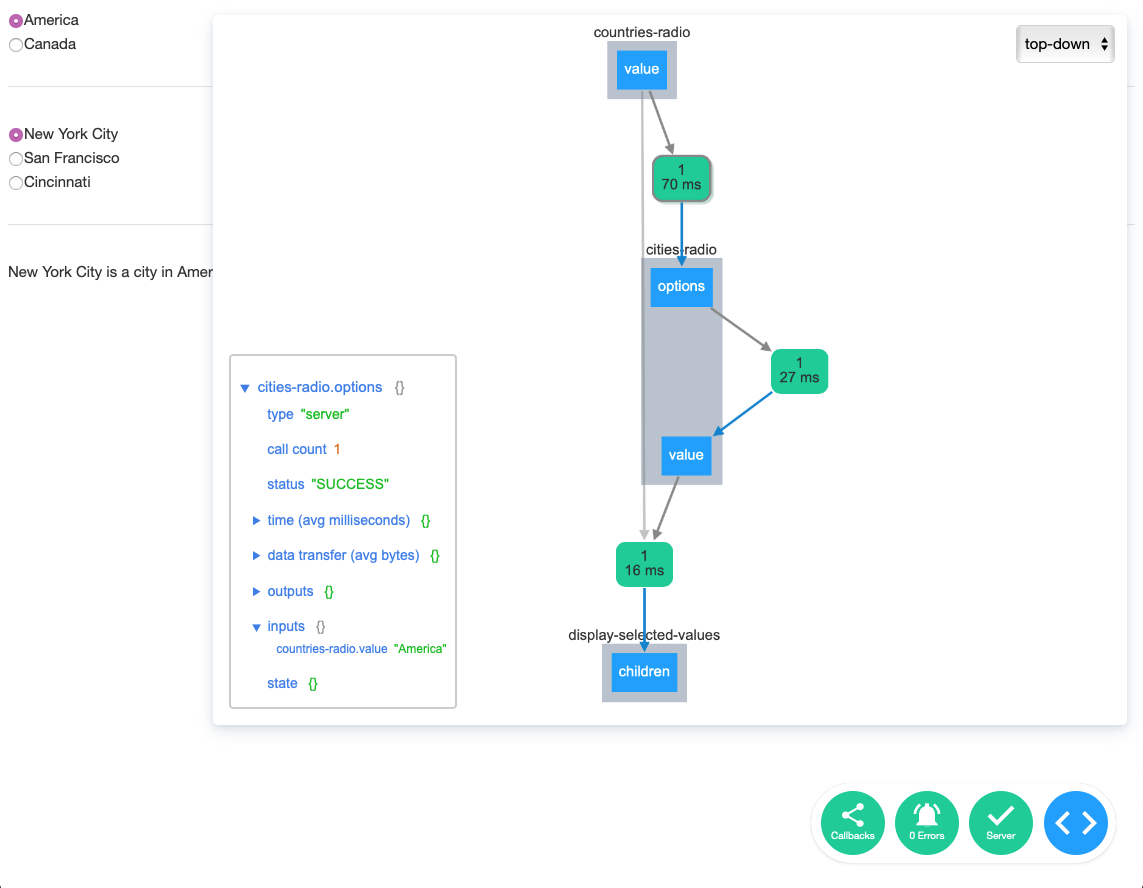
- The rounded green boxes represent your callback functions:
- The top number represents the number of times the function has been called
- The bottom number represents how long the request took. This includes the network time (sending the data from the browser client to the backend and back) and the compute time (the total time minus the network time or how long the function spent in Python).
- Click on a green box to see the detailed view about the callback. This includes:
type- Whether the callback was a clientside callback or a serverside callback.call count- The number of times the callback was called during your sessionstatus- Whether the callback was successful or not.time (avg milliseconds)- How long the request took. This is the same as the summary on the green box.total- The total time of the request.compute- The time spent running your callback function and serializing & deserializing the data. Serialization and deserialization is a data conversion step that thedashframework framework performs when receiving and sending data to the client.network- The time spent transferring the data from the browser client to the server and back.user: <task-id>- (Optional) Custom timing events captured bydash.callback_context.record_timing(see “Custom Timing Events” below)
data transfer (avg bytes)download- The number of bytes sent from the browser client to the server. This is the data that is passed into your callback function: theInput&State.upload- The number of bytes sent from the server back to the browser callback. This is the data that is returned from your callback function: theOutput.
outputs- A JSON representation of the data that was returned from the callback.inputs- A JSON representation of the data that was passed to your callback function asInput.state- A JSON representation of the data that was passed to your callback function asState.
- The blue boxes represent the input and output properties. Click on the box to see a JSON representation of their current values.
- The dashed arrows (not visible in the screenshot) represent
State. - The dropdown in the top right corner enables you to switch layouts
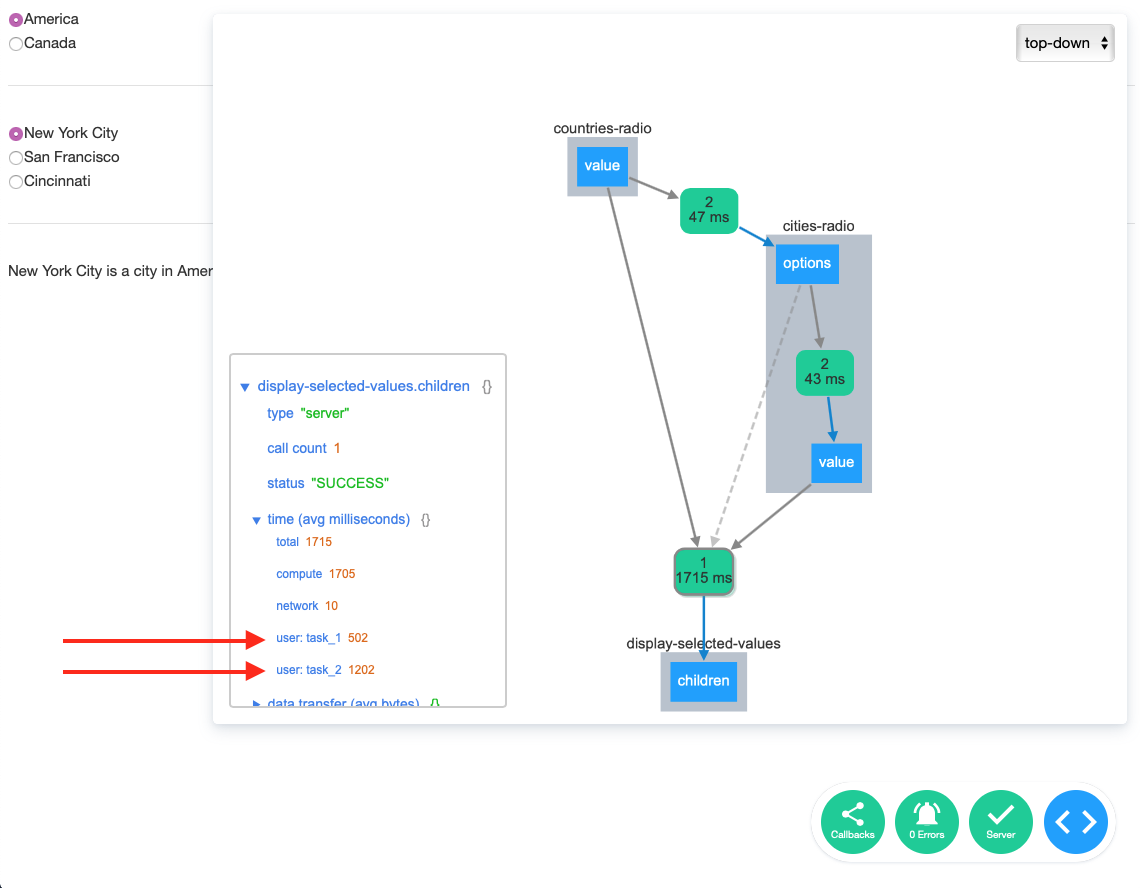
Custom Timing Events
The timing data reported above includes the entire time that the callback is running.
To report more granular timing data about certain steps within your callback, use dash.callback_context.record_timing. For example:
from timeit import default_timer as timer

@callback(Output('graph', 'figure'), Input('dropdown', 'value'))
def update_graph(value):
    start_1 = timer()
    # perform some action
    dash.callback_context.record_timing('task_1', timer() - start_1, 'The 1st task')

    start_2 = timer()
    # perform another action
    dash.callback_context.record_timing('task_2', timer() - start_2, 'The 2nd task')

    return px.scatter()
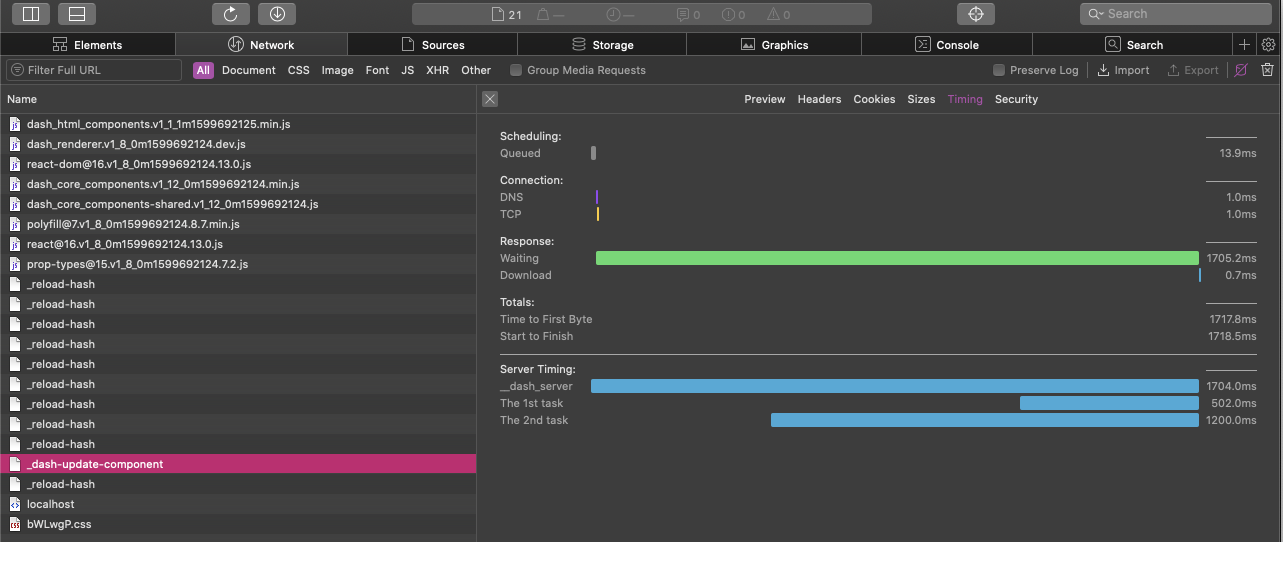
With this, the custom timing data is available in two places:
- In the detailed view.
- In your browser’s network panel under the
_dash-update-componentrequest.
Reference
>>> help(dash.callback_context.record_timing)
dash.callback_context.record_timing(name, duration=None, description=None)
Records timing information for a server resource.
    :param name: The name of the resource.
    :type name: string

    :param duration: The time in seconds to report. Internally, this
        is rounded to the nearest millisecond.
    :type duration: float or None

    :param description: A description of the resource.
    :type description: string or None
Code Reloading & Hot Reloading
By default, Dash includes Code Reloading & Hot Reloading. This means that Dash will automatically refresh your browser when you make a change in your Python or CSS code.
The Code Reloading feature is provided by Flask & Werkzeug via the use_reloader keyword.
A caveat of Code Reloading is that your app code is run twice when
starting: once to start the parent process and another time to run the child process that gets reloaded.
Hot reloading works by running a “file watcher” that examines your working directory to check for changes. When a change is detected, Dash reloads your application in an efficient way automatically.
A few notes about how Code Reloading & Hot Reloading works:
- Hot reloading is triggered when you save a file.
- Dash examines the files in your working directory.
- CSS files are automatically “watched” by examining the assets/ folder. Learn more about css
- If only CSS changed, then Dash will only refresh that CSS file.
- When your Python code has changed, Dash will re-run the entire file and then refresh the application in the browser.
- Hot reloading will not save the application’s state. For example, if you’ve selected some items in a dropdown, then that item will be cleared on hot-reload.
- Hot reloading is configurable through a set of parameters: use_reloader, dev_tools_hot_reload, and the dev_tools_hot_reload_interval, dev_tools_hot_reload_watch_interval,
dev_tools_hot_reload_max_retry
If Hot-Reloading is Too Slow
If your application initialization is too slow for hot reloading, then consider:
- Saving certain initialization steps to a file in development. For example, if your app initialization downloads a static file from a remote service, perhaps you could include it locally. Consider using the
.arrowfile format so that loading the file is fast or apicklefile to save & load all of your variables. - Consider using Dash in a Jupyter Notebook to isolate your initialization routines from your Dash app and callbacks. Execute your initialization routines in their own cell(s) separate from your Dash app so that you don’t need to re-run these cells when iterating on your app code. This is supported in Dash 2.11 and later. You can use JupyterDash if you are using an earlier version.
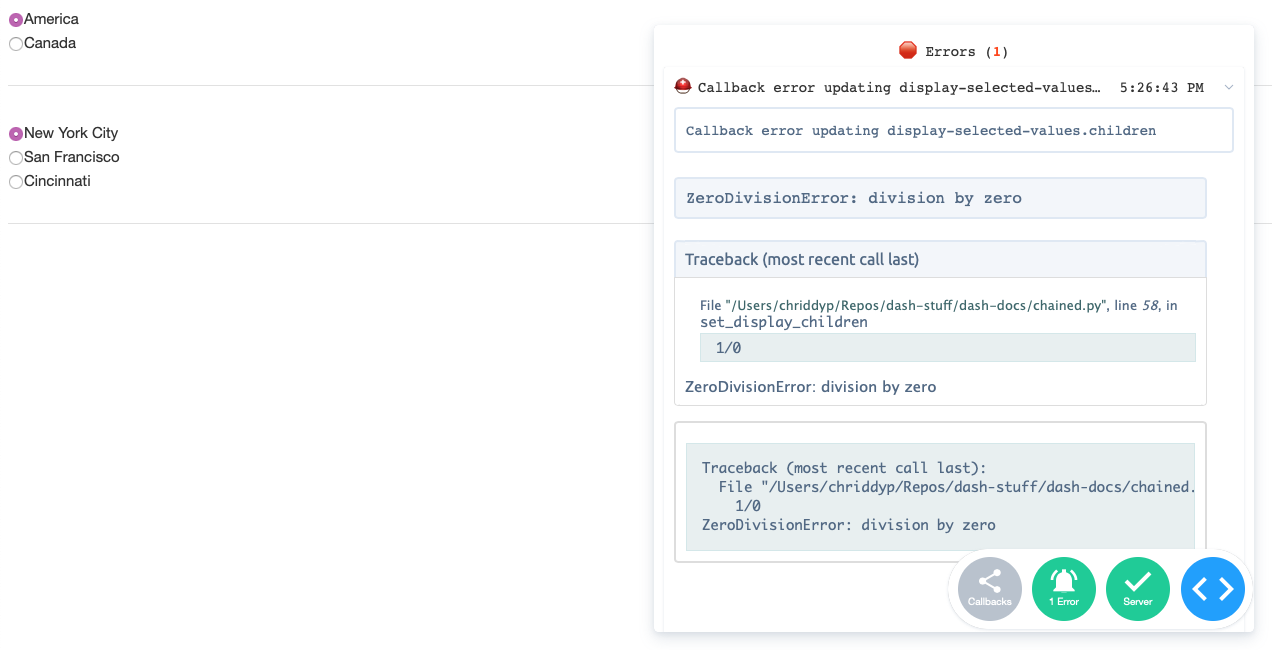
In-App Error Reporting
Callback error messages and JavaScript error messages are displayed as a pop-up within your application instead of in your terminal.
Our intention was to reduce the context switch during development between terminal, code editor, browser and browser debug console. With error messages in the app, you can just focus on your browser and your code editor.
To hide the error message, click on the Blue Dev Tools icon in the bottom right corner and then click on the “Toggle Errors” icon.
Component Validation
Dash’s Dev Tools validates the shape of the properties of components.
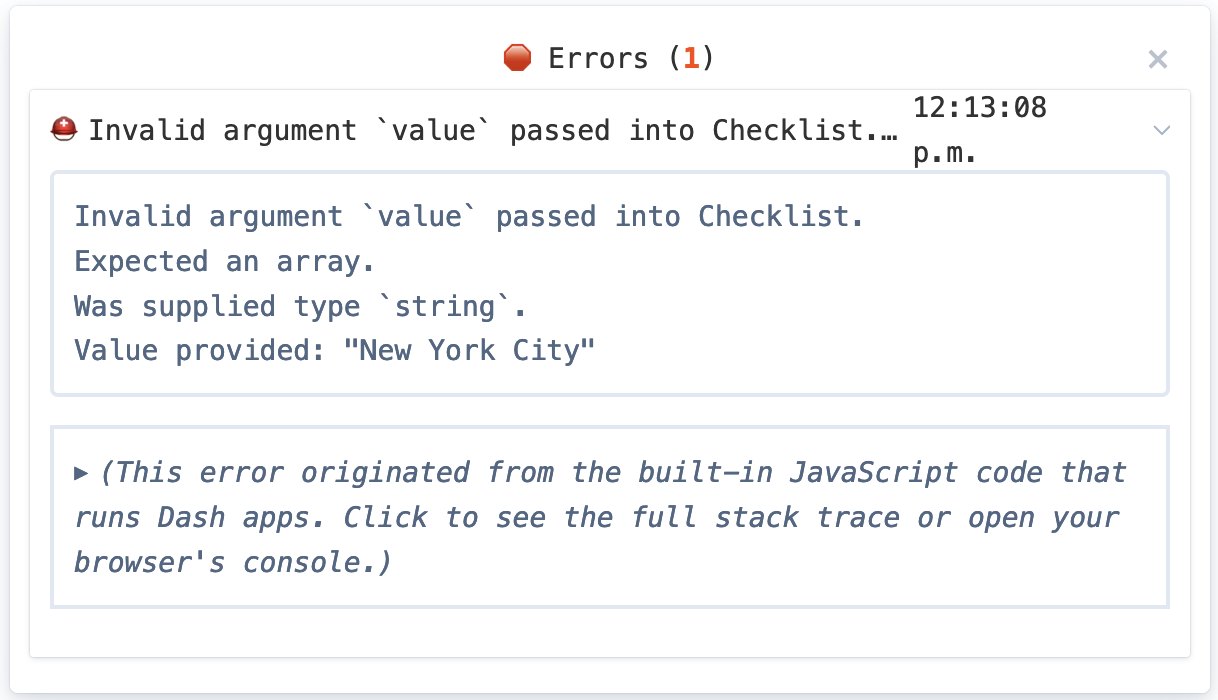
For example, if you provide value as a string to dcc.Checklist:
dcc.Checklist(
    options=['New York City', 'Montréal', 'San Francisco'],
    value='New York City'
)
Instead of as a list:
dcc.Checklist(
    options=['New York City', 'Montréal', 'San Francisco'],
    value=['New York City']
)
You’ll see an error message like:
Invalid argument `value` passed into Checklist.
Expected an array.
Was supplied type `string`.
Value provided: "New York City"
As a Dash component author, you do not need to write any input argument validation logic for your component. However, you will need to provide type definitions within the propTypes of your component. The more specific, the better. These propType definitions are used for validation and automatic docstring generation.
Note: You can disable the check by setting dev_tools_props_check=False. But we strongly recommended to fixing the property type errors instead.
Under the hood, we leverage React’s
Error Handling feature and Type Checking with propTypes. These error messages are parsed & modified by Dash before presented to the user. View the source.
Serving the Dev Bundles & Source Maps
In dev mode, component authors can include source maps or dev bundles in their component suite. These source maps or dev bundles will be served
when dev_tools_serve_dev_bundles=True. In production they will be omitted.
The component libraries that are maintained by Plotly (including
dash-core-components,dash-html-components,dash-table) provide the sourcemaps viaasyncloading. This means that they will be loaded on-the-fly when requested by the browser in the browser’s console regardless of the value ofdev_tools_serve_dev_bundles.
Configuring Dash Dev Tools & app.run Reference
Configuring with run
Dev Tools is configured by the run command, which is typically:
app.run(debug=True)
Full Reference
app.run(host='127.0.0.1', port='7080', proxy=None, debug=False, dev_tools_ui=None, dev_tools_props_check=None, dev_tools_serve_dev_bundles=None, dev_tools_hot_reload=None, dev_tools_hot_reload_interval=None, dev_tools_hot_reload_watch_interval=None, dev_tools_hot_reload_max_retry=None, dev_tools_silence_routes_logging=None, dev_tools_prune_errors=None, **flask_run_options)
With debug=True, all of the Dev Tools features listed below enabled.
Individual dev tools featured can be turned on or off with keyword
arguments in app.run. These include:
debug, bool, activate all the dev tools listed below.use_reloader, bool, set toFalseto turn off Code Reloading. Code Reloading restarts.
your application when you change code.dev_tools_ui, bool, set toFalseto explicitly disable dev tools UI in debugger mode (default=True).
This UI is the blue button in the bottom right corner that contains the error messages, server status, and
the callback graph.dev_tools_props_check, bool, set toFalseto explicitly disable Component Validation (default=True).dev_tools_hot_reload, bool, set toTrueto enable hot reloading (default=False).dev_tools_hot_reload_interval, float, interval in seconds at which the renderer will request the reload hash and update the browser page if it changed. (default=3).dev_tools_hot_reload_watch_interval, float, delay in seconds between each walk of the assets folder to detect file changes. (default=0.5 seconds)dev_tools_hot_reload_max_retry, int, number of times the reloader is allowed to fail before stopping and sending an alert. (default=8)
dev_tools_silence_routes_logging, bool, remove the routes access logging from the console.dev_tools_serve_dev_bundles, bool, serve the dev JavaScript bundles.dev_tools_prune_errors, bool, simplify tracebacks to just user code, omitting stack frames from Dash and Flask internals. (default=True)
For example, to turn off the automatic reloader but keep the rest of the development features, you could run:
app.run(debug=True, use_reloader=False)
Configuring with enable_dev_tools
app.enable_dev_tools(debug=None, dev_tools_ui=None, dev_tools_props_check=None, dev_tools_serve_dev_bundles=None, dev_tools_hot_reload=None, dev_tools_hot_reload_interval=None, dev_tools_hot_reload_watch_interval=None, dev_tools_hot_reload_max_retry=None, dev_tools_silence_routes_logging=None, dev_tools_prune_errors=None)
Use enable_dev_tools when you want to turn on certain features when deploying your application with gunicorn.
A common use case is to enable the Callback Graph to diagnose performance or network issues in your deployed application:
app.enable_dev_tools(
    dev_tools_ui=True,
    dev_tools_serve_dev_bundles=True,
)
We do not recommend using these settings in your deployed applications in general usage because:
- Displaying serverside tracebacks is a security vulnerability
- Dev Tools features incur a performance penalty: There is a cost to running component validation and loading the dev bundles.
Configuring with Environment Variables
All the dev_tools variables can be set with environment variables, just replace the dev_tools_ with dash_ and convert to uppercase.
This allows you to have different run configs without changing the code.
Linux/macOS:
export DASH_HOT_RELOAD=false
Windows:
set DASH_DEBUG=true
By placing these features in
run, we prevent you from using these
features in production. As a reminder,runshould not be used
when deploying your application in production. Instead, the app should
be run withgunicornon theserver = app.serverinstance.
We don’t run use dev tools in production because:
- Displaying serverside tracebacks is a security vulnerability
- Dev Tools features incur a performance penalty: there is a cost to component validation and loading the larger dev bundles.